Our arth Water Risk Model processes huge data and information on factors which affect water demand and supply. The model integrates and analyses hydrological, climatological, economic, demographic, planning and business information, independently as well as interactively (see Figure 1).
Figure 1: Integrating different facets of information on water supply and demand

The core principle of the water risk model is that both demand and supply have been matched geographically. Using a geographic information system (GIS), many thematic maps have been overlaid to provide a composite overview. Figure 2 shows a conceptual representation of this, with just a few map layers. In reality, hundreds of maps, arrays and algorithms have been used to analyse information about hydrology, population, economic activities, political boundaries and other natural and social factors. To simplify the process, the whole world was divided into around 2.5 million square of 5X5 arc minute, which is around 25-50 square kilometers on ground (depending upon the latitude).
On the supply side, WATER RISK MODEL considers water availability by river basin (i.e. river flow), storage capacity of dams, historical volumes of rainfall and runoff, and groundwater storage and recharge. In addition, it incorporates the frequency of floods and droughts. To analyse future water availability with respect to climate change, WATER RISK MODEL uses the Intergovernmental Panel on Climate Change’s (IPCC) Special Report on Emissions Scenarios (SRES) A1B. The current WATER RISK MODEL takes into account variability in precipitation under the A1B climate scenario and applies the same for overall water availability.
Figure 2: Layers of various geospatial maps

Water supply maps
- Renewable water resources
- River basin
- Rainfall
- Runoff
- Storage capacity
- Groundwater
- Drought
- Flood
Water demand maps
- Agriculture
- Irrigation
- Domestic water
- Industries and manufacturing
Admin maps
- Political boundaries
- Demographic
- Economic
- Land use
- Uurban and rural areas
On the demand side, the model takes in-depth account of three sectors – domestic, agricultural and industrial. The demand for domestic water includes both formal and informal water supply. For agricultural water demand, WATER RISK MODEL considers both rainfed and irrigated agriculture. The industrial water demand draws data from 13 major industries: power generation, oil and gas, petroleum refining, mining, chemicals, metals, automotive, food and beverages, microelectronics, pulp and paper, textiles, pharmaceuticals and bio fuel.
Demand for domestic water was estimated based on population density, urban and rural location, utility water supply, coverage and other socio-economic attributes. To estimate agricultural water demand spatially, WATER RISK MODEL incorporated land use maps, irrigation intensity maps, agricultural water withdrawal, and Food and Agriculture Organization’s (FAO) and International Water Management Institute’s (IWMI) agriculture water-use scenarios. Water demand points for most of the metal refining, mining, oil and gas, petroleum refining and power generation industries were assigned based on their locations. These five industries cumulatively account for ~85% of total industrial water demand. The remaining industrial water demand was allocated spatially, weighted on the basis of domestic water demand with emphasis on urban water. Note that it is difficult to predict geographical locations of future industrial expansion. Nonetheless, it is our intention to update the existing geographical weightings based on new data, as well as to add more specific location data for those industries for which demand is currently weighted based only on domestic water use.
WATER RISK MODEL’s water demand forecasting model is quite complex and is based on a mix of primary and secondary research. WATER RISK MODEL takes into account the current state of water supply, water use and efficiency, socio-economic data, financial information, and business production and processes input/output data. Based on historical trends and current policies all such factors have been estimated for the future. While most production data were taken from public data sources such as provided by the FAO, U.S. Geological Survey (USGS), U.S. Energy Information Administration (EIA), International Energy Agency (IEA) and industry associations, some datasets were acquired from private agencies. To estimate the total water use for industrial production, WATER RISK MODEL developed a country, sector and process water-use and water-use-efficiency matrix. It was developed after an extensive literature review; analyses of Countries’ water markets, use of desalination and water reuse; a primary survey of water technology companies; and research on investment in the water sector and on R&D, local and federal government spending, and GDP.
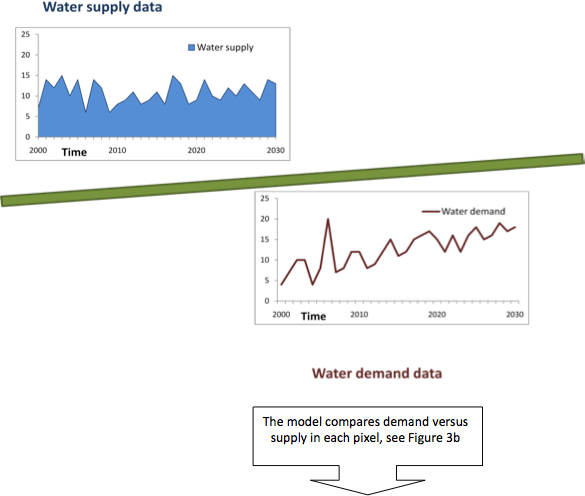
Figure 3: Water demand versus supply

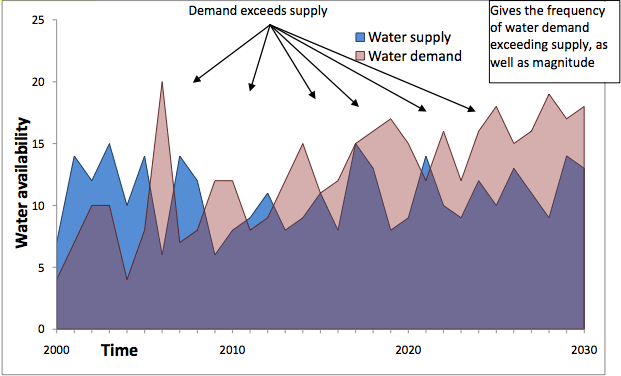
Water scarcity is a simple function of water demand over supply. As discussed above, water demand is estimated based on production processes and water used for the same. Water supply fluctuates based on historical trend and climate change scenario for the future. Such simple supply and demand formula gets very complex in the model once factors affecting water use and availability over time are integrated with associated uncertainty. For each pixel – for both water supply and each ‘segment’ of demand – model ran a stochastic analysis based on Monte Carlo simulation (500 reiterations) using Latin Hypercube Sampling (LHS). The end result transforms uncertainties into quantified risk index, as the probability of demand overrunning supply over time for each individual pixel (Figure 3, 3a and 3b). WATER RISK MODEL is a result of over 300 trillion calculations across 2.5 million geographic location points, around 200 countries and 14 sectors. The first results of data from an early beta version of the index are shown on this website.
Figure 3a: Water supply and demand projections


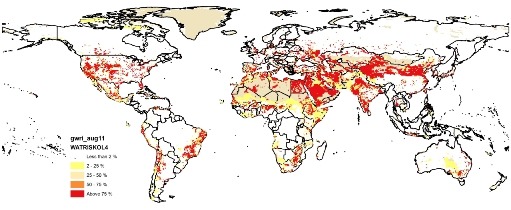
Figure 4: Water Risk 2030 sample output

Collecting, collating, managing and analysing the available datasets proved to the biggest challenges of a project of this kind. Source data were in various formats and scales of resolution. Attribution, down scaling and up scaling of geospatial data sometimes led to error, perhaps inevitably with the given data limitations. Where there were discrepancies, other secondary data sources were consulted for verification purposes. While we do not claim that the data provided here is faultless, we believe that for many practical purposes, this is the best single source overview that the water sector has so far. This is an effective pragmatic tool providing for a more coherent and up-to-date water risk information.
